
Marathon and Half Marathon Pace Planning
A marathon pace calculator translates a finishing-time scenario into an average pace and cumulative checkpoints. A half marathon pace calculator uses exactly the same relationship with a different distance. Neither calculation decides whether a goal is realistic, chooses a training plan or predicts the conditions on race day. This guide shows how to build a readable planning note from an illustrative four-hour marathon and a two-hour half marathon, keeping even-distance arithmetic separate from tactical decisions and actual event measurements.
Begin with the event distance rather than a rounded label
The marathon distance used here is 42.195 kilometres; the half marathon is 21.0975 kilometres. These distances are listed in World Athletics terminology. Entering forty-two kilometres instead of 42.195 changes the average pace associated with the same finish time. The difference may seem small, but it becomes visible when a planning note is compared with a full-distance result.
Use the preset button when you want the conventional distance in the calculator. Then inspect the unit label: the tool can express the same distance in kilometres, miles or metres. A rounded spoken description such as twenty-six miles should not silently replace a more precise input. Write the exact distance used next to the answer so another person can understand why their calculation might differ.
A watch can show a distance different from the event distance. This calculator does not determine which measurement should be used for a particular comparison. If you want pace against the conventional race length, enter that length with the associated finish time. If you want the rate implied by your recorded trace, enter the recorded length instead. Keep those results labeled rather than merging their definitions.
Work through a four-hour marathon scenario
Four hours is 14,400 seconds. Divide by 42.195 kilometres to obtain approximately 341.2727 seconds per kilometre. The display rounds that to 5:41/km. The mile equivalent is approximately 549.2251 seconds per mile, displayed as 9:09/mi. These rounded labels describe the average implied by the four-hour scenario; they do not imply that every real split must match them exactly.
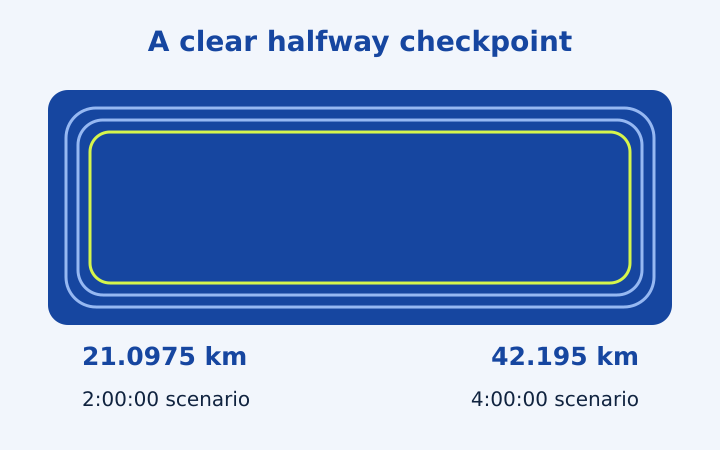
At ten kilometres, the unrounded average produces approximately 3,412.7266 seconds, or 56:53 when displayed to whole seconds. At twenty kilometres the cumulative reading is approximately 1:53:45. At halfway, the even-rate calculation is exactly two hours because the half marathon distance is half the marathon distance. The final cumulative row is four hours.
The example is deliberately easy to cross-check: doubling two hours gives four, and doubling 21.0975 kilometres gives 42.195. These relationships let you confirm the halfway entry without relying on a second website. For other time scenarios, the same symmetry holds when the pace is kept constant. A halfway target derived this way is an arithmetic checkpoint rather than evidence about how an individual race will unfold.
Read the final fraction of a kilometre correctly
A kilometre table has forty-two full rows and one final partial segment for this distance. The last segment is 0.195 kilometres, so it cannot have the same duration as a full kilometre. At the four-hour average, it takes approximately sixty-six and a half seconds. The finish row still ends at the total distance and total time.
A mile table instead has twenty-six complete miles and a final fraction. That is another valid way to divide the same event. The two tables do not place every checkpoint at the same physical location, so their row numbers cannot be compared directly. Choose the units matching the note you want to carry or the markers you expect to reference, while remembering that the calculator has no knowledge of actual marker placement.
Display rounding can make additions look slightly different
Each shown checkpoint is rounded from the underlying calculation. Adding forty-two individually rounded full-kilometre durations may not reproduce the displayed final time exactly. The table does not calculate its finish by adding those rounded labels. It calculates each cumulative value from the unrounded pace and distance, avoiding a chain of small rounding errors.
Build the corresponding half marathon note
A two-hour half marathon has the same average pace as the four-hour marathon example because both time and distance are halved. Select the half marathon preset and enter two hours. The displayed average remains 5:41/km and 9:09/mi. The finishing row occurs at 21.0975 kilometres, with twenty-one full kilometre rows followed by a short final segment.
That shared pace is an equality in these two chosen scenarios. It does not mean that a runner who completes one event in the stated time will necessarily complete the other in the corresponding time. Holding pace constant and estimating performance across different distances answer different questions. The first is multiplication; the second introduces a model and assumptions about how performance scales.
For a different half marathon scenario, enter one hour and forty-five minutes. The duration is 6,300 seconds, giving approximately 298.6136 seconds per kilometre, displayed as 4:59/km. A full-length checkpoint note can be copied from the tool. If you later change the distance, recalculate rather than reusing the same finish table with a different heading.
Choose how the note will be used
An even-split table describes a constant average over equal distances. It can be a reference for discussing a goal, checking arithmetic or understanding a previous finish time. It does not model hills, wind, congestion, stops, course surfaces or changes in effort. Those omissions are features of a simple distance-time worksheet, and they should remain visible when the result is shared.
You may choose to write only a few cumulative checkpoints rather than carry every row. If you do, retain the distance beside each time. A number such as 56:53 without its ten-kilometre label can easily be misread as a lap duration or another checkpoint. Keep the total event distance and the original finish-time scenario at the top of the note for context.
The running pace calculator lets you change one assumption at a time. Compare a new goal time with the previous one while keeping the event distance fixed. This controlled comparison is easier to interpret than simultaneously changing distance, units and time. It also makes a mistaken field entry more obvious.
Keep optional predictions apart from finish-time arithmetic
The optional power-law model starts from an entered distance and time, then applies a chosen exponent to a target distance. That result is not equivalent to simply holding pace constant. Use it only when you want to inspect that particular mathematical scenario, and retain the exponent in the copied note. The model does not evaluate preparation or personal suitability.
The 5k and race-time examples show the difference between constant pace and model-based scaling. Do not replace the event organizer’s timing definitions, course information or instructions with either calculation. A useful planning note is explicit about its inputs and modest about what the resulting number can explain.
Frequently asked questions
Do a four-hour marathon and two-hour half have the same average?
Yes, for these arithmetic scenarios: time and distance are both halved. This does not predict individual performance between events.
Why is the final kilometre row shorter?
A marathon is 42.195 km, leaving a final 0.195 km after 42 complete kilometre segments.
Put the numbers into your own note
Open the pace calculator with your own distance and time. Choose matching units, read the assumptions and copy the even-split note. Treat any race-time model as a scenario, not a promised performance.
More notes from the race deck
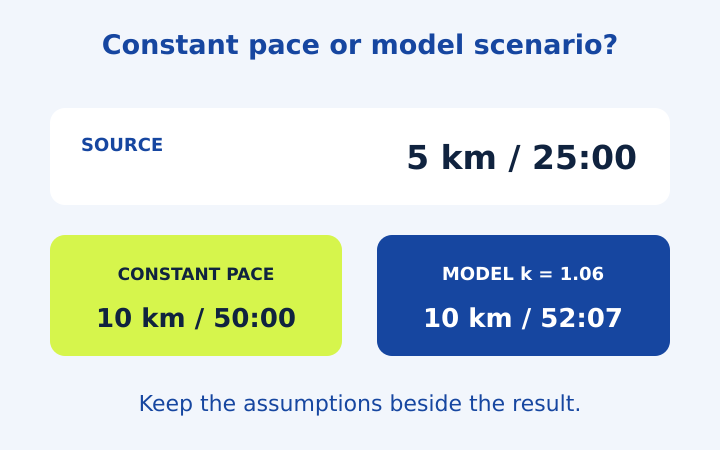
5k Pace and Race Time Predictor Examples
Follow five running arithmetic examples, including 5k pace, partial splits and an optional race-time model with its exponent clearly stated.
Read the note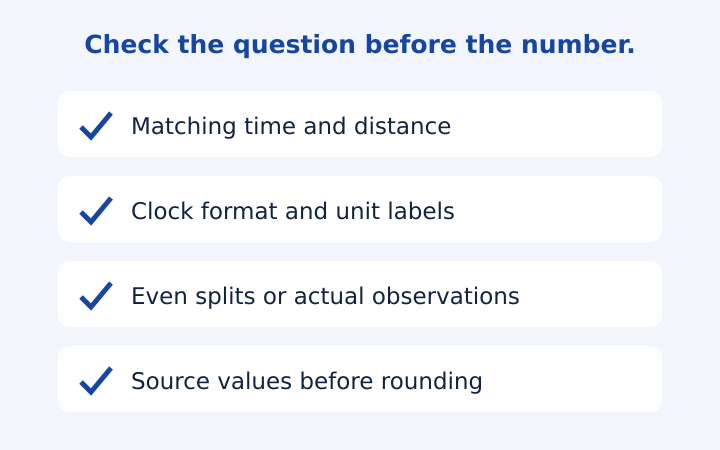
Running Pace Calculation Mistakes to Catch
Catch moving-time mismatches, clock-format errors, unweighted averages and split-table assumptions before saving a running pace result.
Read the note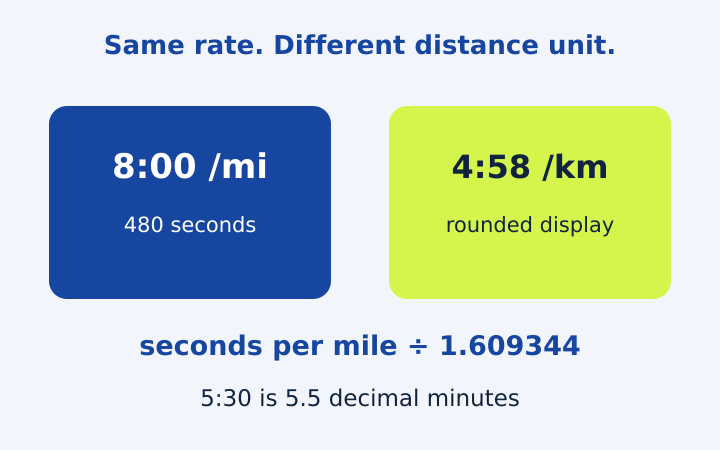
Pace per Mile to Km: Units Without Confusion
Convert mile and kilometre pace accurately, distinguish clock notation from decimal minutes, and compare pace with speed using worked examples.
Read the note